
Clapham Common and Abbeville has Lambeth's lowest claimant rate, 2.8%; Clapham Park is at 7.1%. The borough's 15,085 total is exactly where it was a year ago.
The Lambeth ward with the fewest people claiming unemployment-related benefits is in Clapham. So is one of the wards with the most.
In Clapham Common and Abbeville, 2.8% of residents aged 16 to 64 were claiming in September. In Clapham Park, about a mile south-east, the figure was 7.1%. That is two and a half times as high, and above the borough average.
The figures are the Office for National Statistics’ claimant count for September 2026, published on nomis. They break the borough down into its 25 wards.
The borough total has not moved in a year
15,085 Lambeth residents were claiming in September, or 6.2% of 16 to 64-year-olds. That is exactly the number recorded in September 2025.
Two years ago, in September 2024, it was 14,640. So Lambeth is up 3.0% over two years, while London is down 0.6% over the same period, from 352,455 to 350,280.
Lambeth’s rate of 6.2% compares with:
- London, 5.6%
- Southwark, 5.7% (13,425 claimants)
- Wandsworth, 4.0% (10,150 claimants)
- the UK, 3.9%
Lambeth has the 12th highest rate of London’s 33 boroughs. Newham and Barking and Dagenham are highest, at 7.5%.
Clapham’s four wards
| Ward | Claimants | % of 16 to 64s | Of whom aged 18 to 24 |
|---|---|---|---|
| Clapham Park | 680 | 7.1% | 90 |
| Clapham East | 450 | 5.6% | 70 |
| Clapham Town | 520 | 4.1% | 85 |
| Clapham Common and Abbeville | 220 | 2.8% | 35 |
| Lambeth borough | 15,085 | 6.2% | 2,225 |
Together the four Clapham wards had 1,870 claimants.
Clapham Park is joint eighth highest of Lambeth’s 25 wards, level with Kennington. Clapham Common and Abbeville is the lowest in the borough. Clapham Town, at 4.1%, is the fourth lowest.
The highest rates are in Gipsy Hill and Streatham Common and Vale, both at 9.1%. Streatham Common and Vale also has the most claimants of any ward, 1,115.
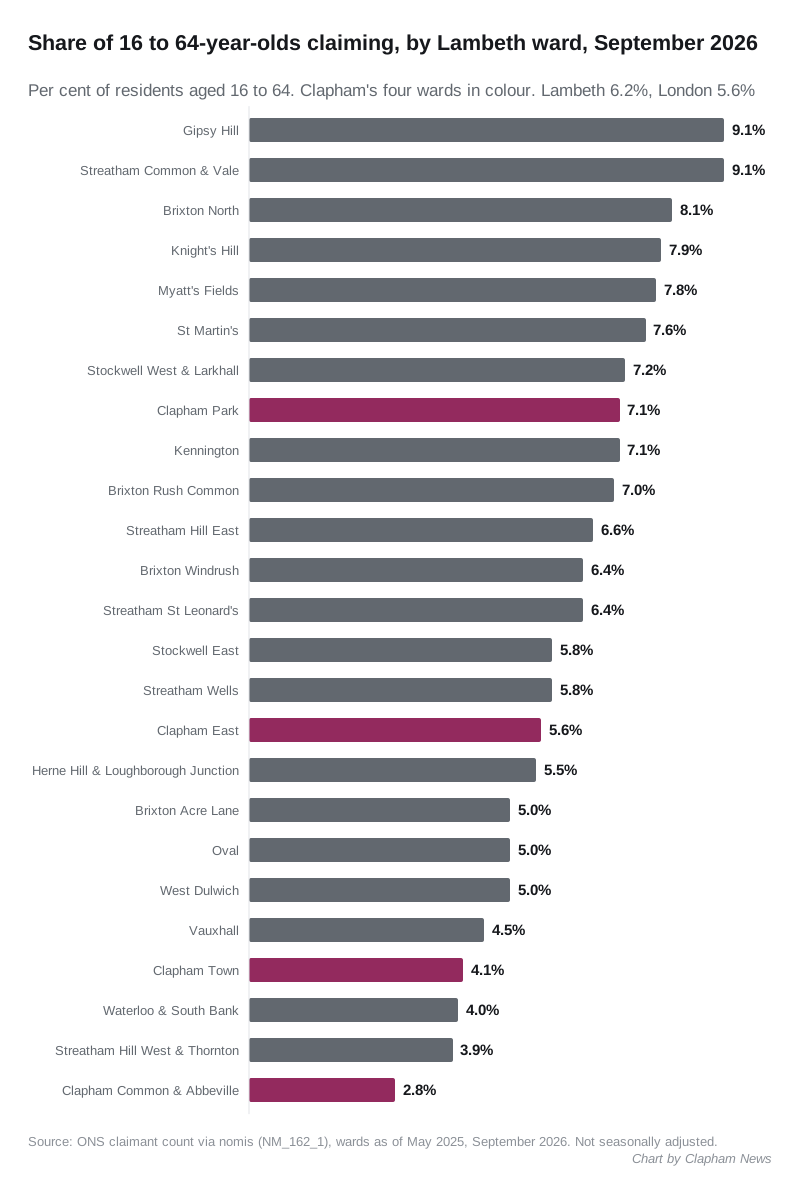
The ward figures come from the same release (nomis, wards as of May 2025). Because ONS rounds every figure to the nearest five, the 25 wards add up to 15,080 rather than the borough’s 15,085.
The ward series only starts in 2025, so there is no ward-level comparison with a year ago yet.
Who is claiming
Across Lambeth, the year to September moved differently for different ages:
- 18 to 24: 2,225, up 2.5% from 2,170
- 25 to 49: 8,435, down 2.1% from 8,620
- 50 and over: 4,425, up 3.1% from 4,290
The rise among young adults is slower than elsewhere. Across London, claimants aged 18 to 24 rose 5.1%, and across the UK 10.6%.
Over two years the picture is sharper. In September 2024 Lambeth had 1,830 claimants aged 18 to 24, so the group is up 21.6% since then. We wrote about that rise in more detail in August.
What the figures do and do not measure
The claimant count is not the unemployment rate. It counts people claiming Jobseeker’s Allowance, or Universal Credit with a requirement to look for work. Some of them are in work on low pay.
The figures are not seasonally adjusted, so September is compared with September. The total rose from 14,620 in August, but numbers often move between the summer months, and ONS can revise the previous month when the next release comes out.
What it means for you
- If you are looking for work, Lambeth’s free employment support service, Be Lambeth, offers help with job searches, CVs and training (Lambeth Council).
- If you are claiming Universal Credit, your work coach at the local Jobcentre Plus can refer you to training and job schemes.
- For your own ward, the full table for all 25 wards is in the chart above.
The next release, covering October, is due in November.
More local data: Clapham house prices and Clapham council tax bands.
Sources: Office for National Statistics, claimant count (NM_162_1) via nomis: Lambeth, Wandsworth, Southwark, London, the UK and all 33 London boroughs, September 2024, September 2025, August 2026 and September 2026, by age; Lambeth wards (as of May 2025), September 2026, count, rate and ages 18 to 24.
Have your say